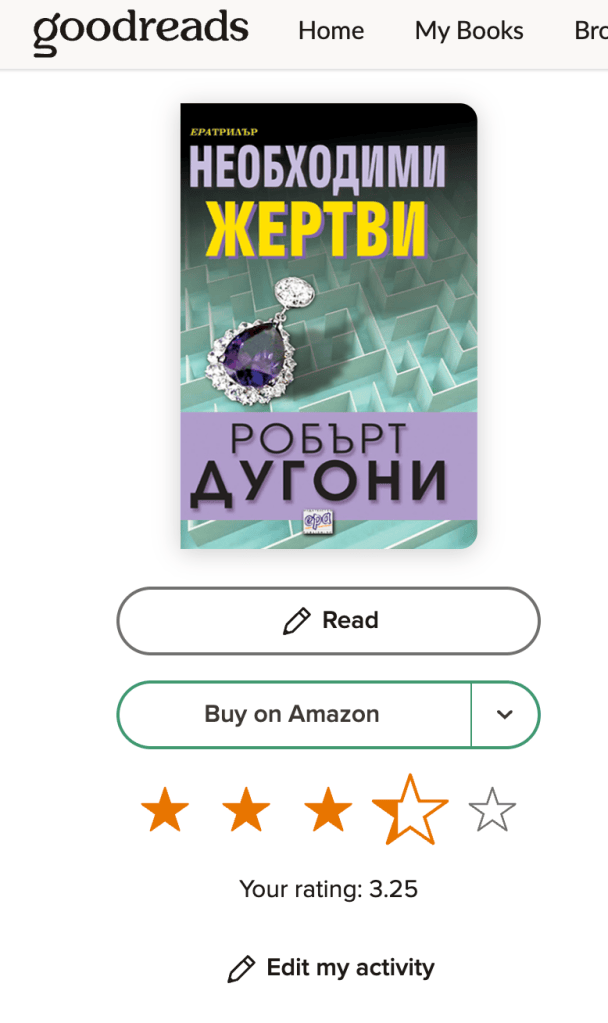
This is difficult to imagine but Goodreads made the biggest revamp of their ranking system one could hope for.
It’s now possible to award anything from 0.25 to 5 stars to books, with an increment of 0.25.
Cats, good books, AI, and religious walking in the city of Sofia
This is difficult to imagine but Goodreads made the biggest revamp of their ranking system one could hope for.
It’s now possible to award anything from 0.25 to 5 stars to books, with an increment of 0.25.
Listening to understand.
When listening other people speak, our brains create a fog of thoughts that wants to get out like AI’s running on a sandbox. We grab those valuable thoughts and stop listening, or we rather start listening to interrupt.
It’s difficult to just listen to understand and let your own thoughts just fly away.
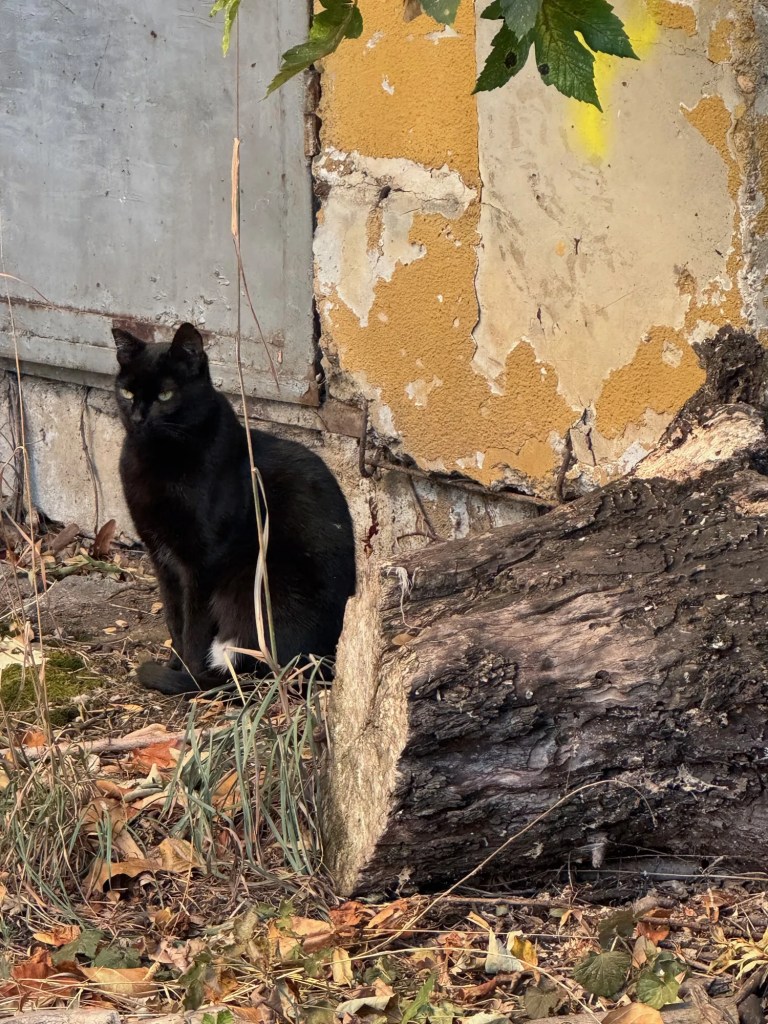
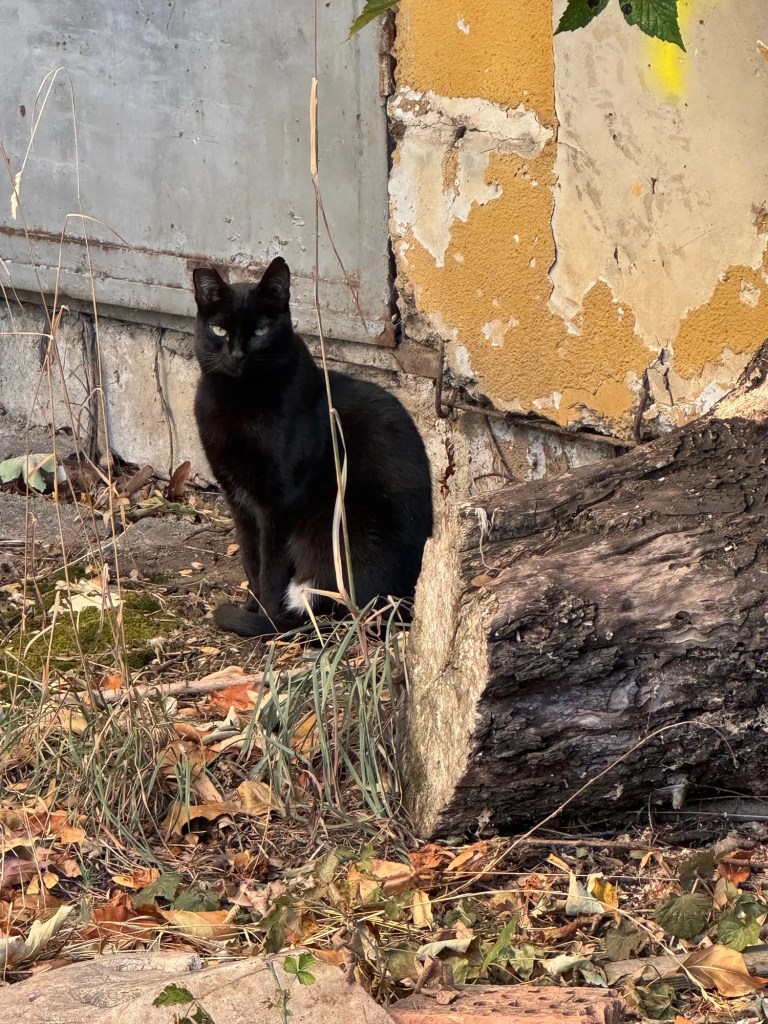
I only noticed this kitten has one blue and one yellow eye after checking the camera roll.
PewDiePie got banned for using ChatGPT to train his local model. His argument, why is it bad to take some data from AI, given that 100% of all AI on the planet is trained using other people’s data and nearly 100% of that data is just taken without permission, sometimes despite all effort by website owners to stop or block scraping.
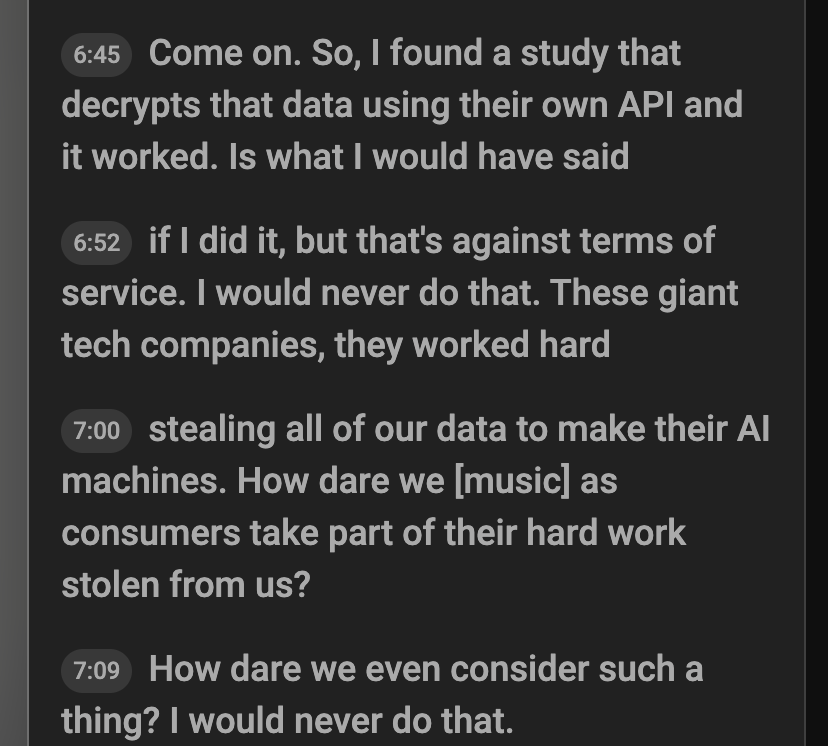
His video is hard to watch but the point is real and this guy knows how to talk to the younger generations.
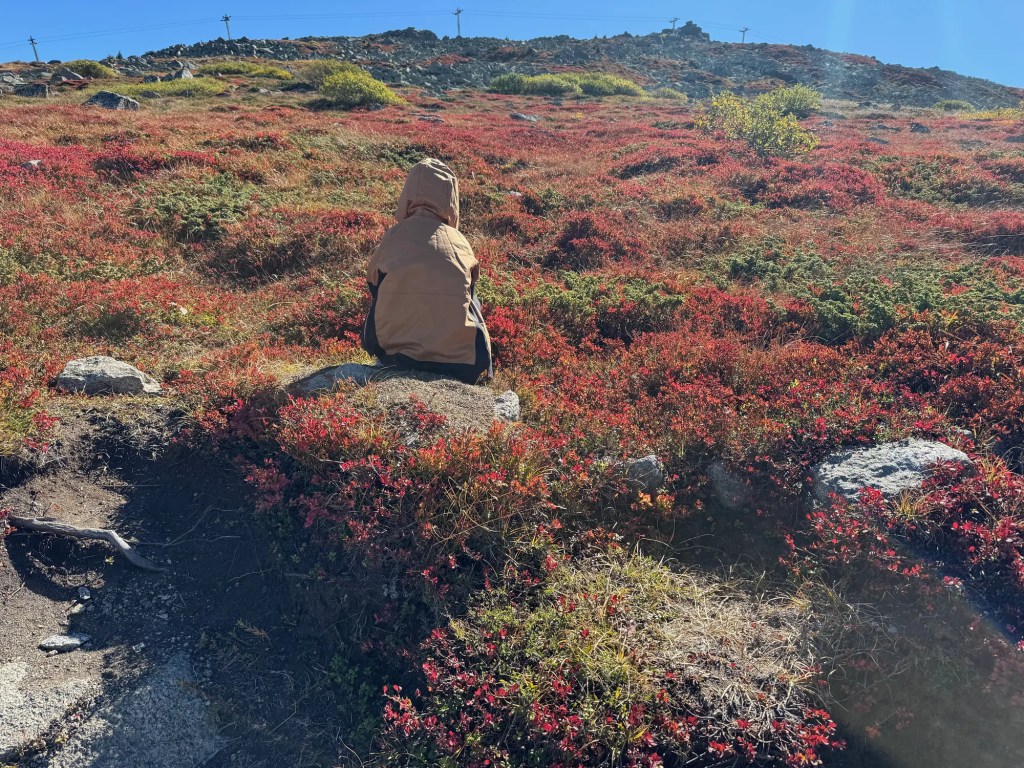
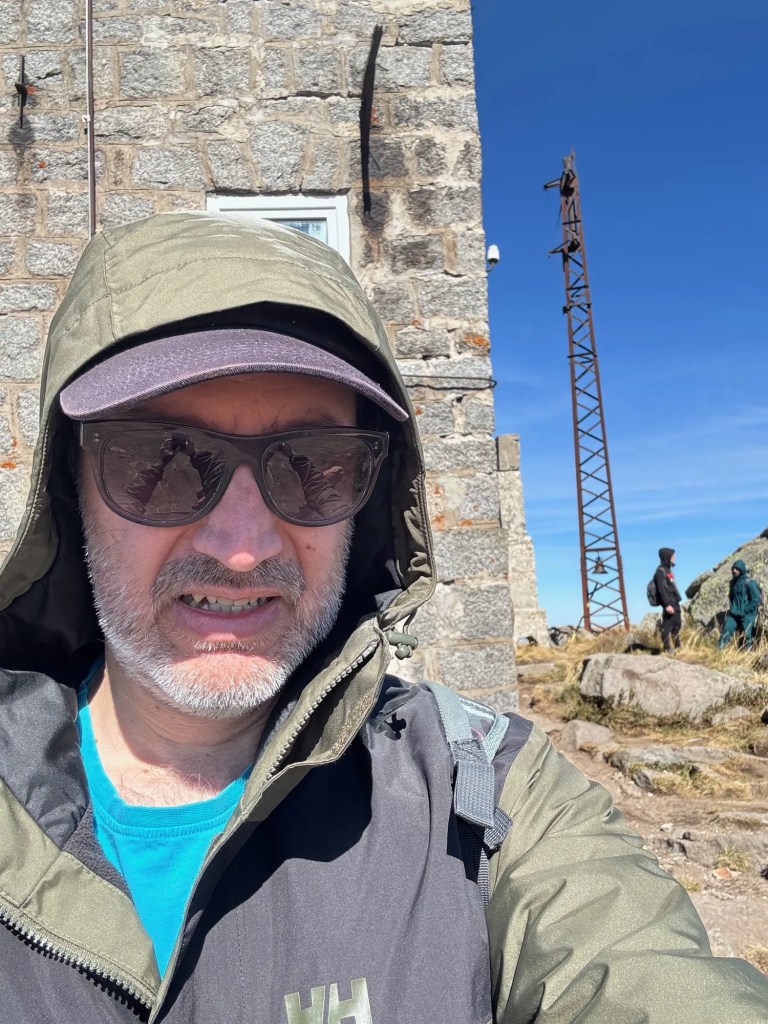
The little one (7) asked to go to Cherni Vrah. After climbing Vihren and Musala, he’s now planning and nagging about going to other peaks, like Mount Olympus in Greece. I was a bit under the weather, with a slightly inured ankle and a neck that can’t turn right. But none of that prevented us from doing the hike. We went to the top. It was beautiful and we had good time. It felt very easy.
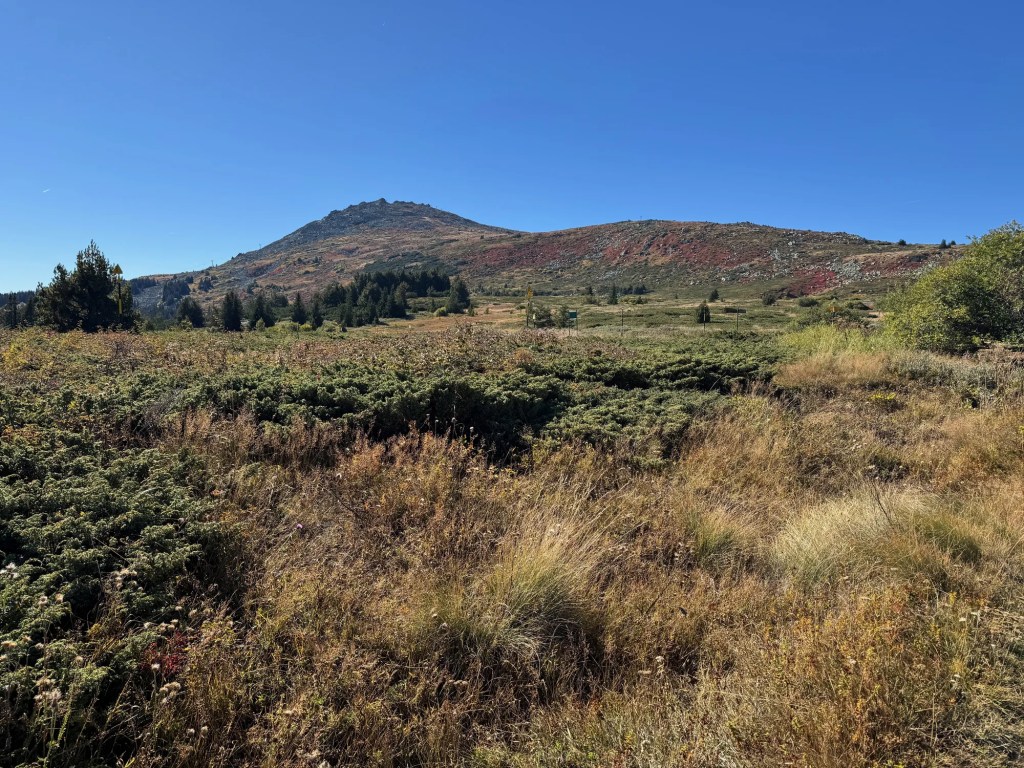
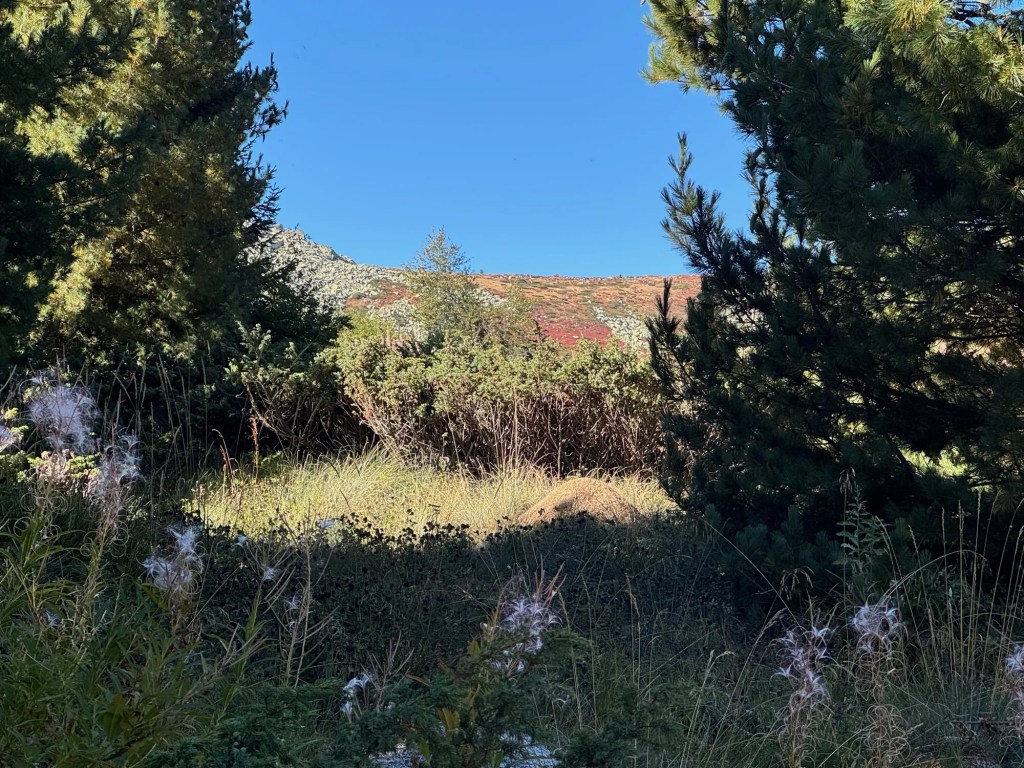
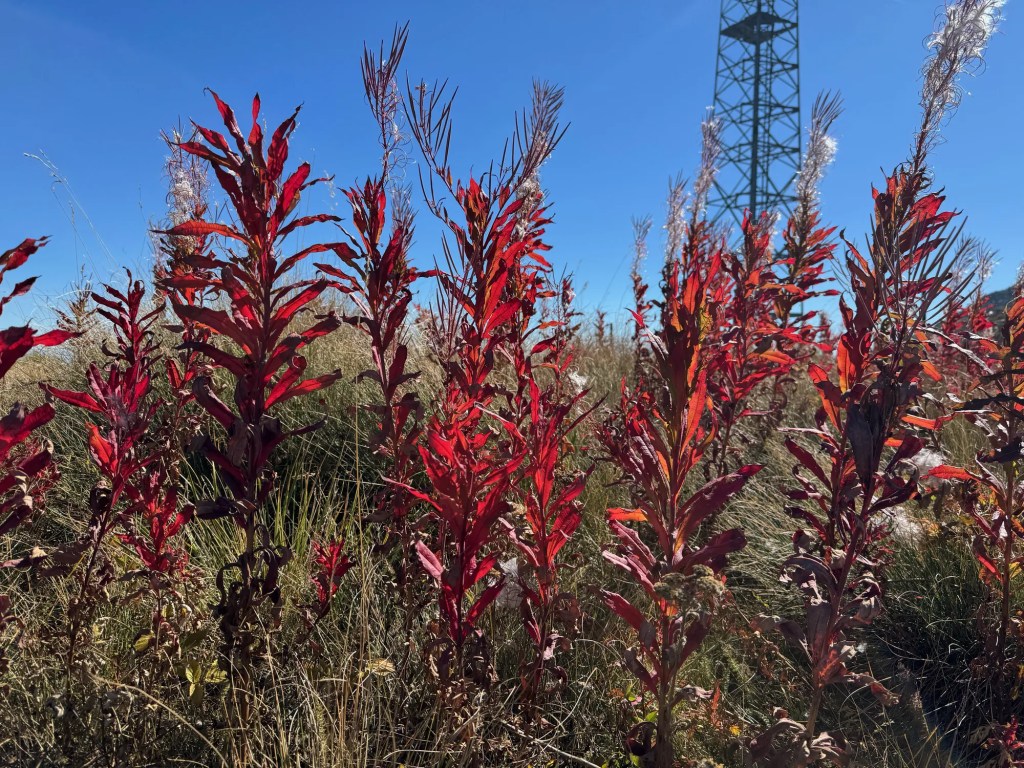
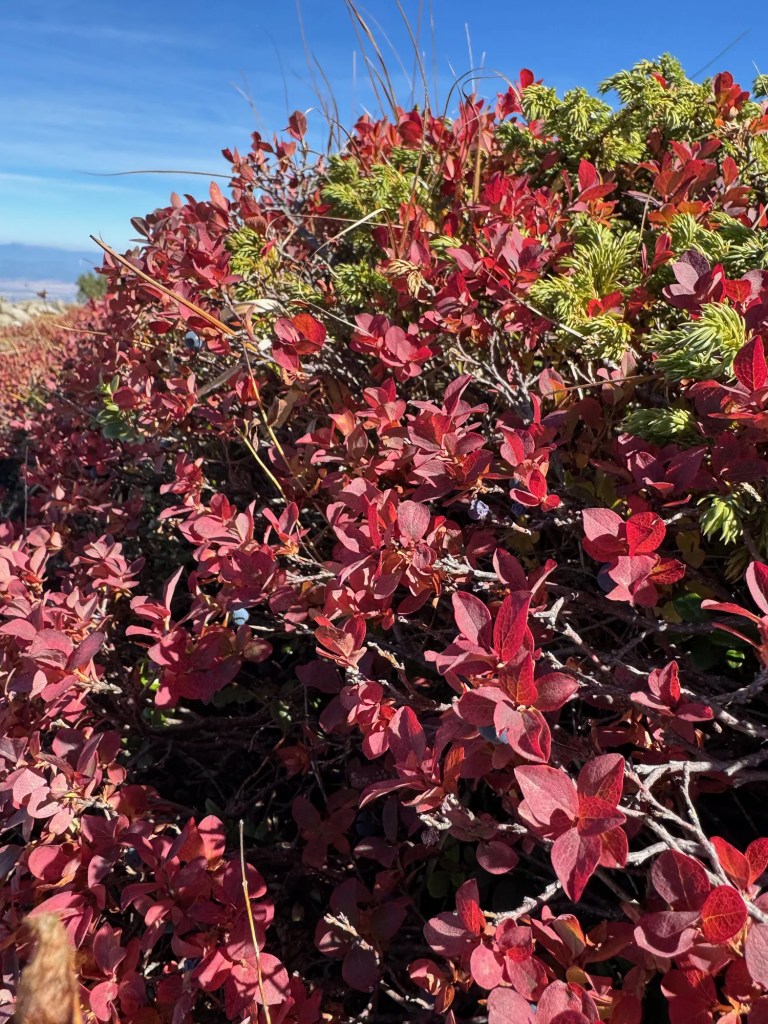
The highlight of our trip was that we found lots of blueberries and some rare raspberries. The raspberries were delicious but scarce, the blueberries were a bit overripe but abundant. The red bushes below are all blueberries.
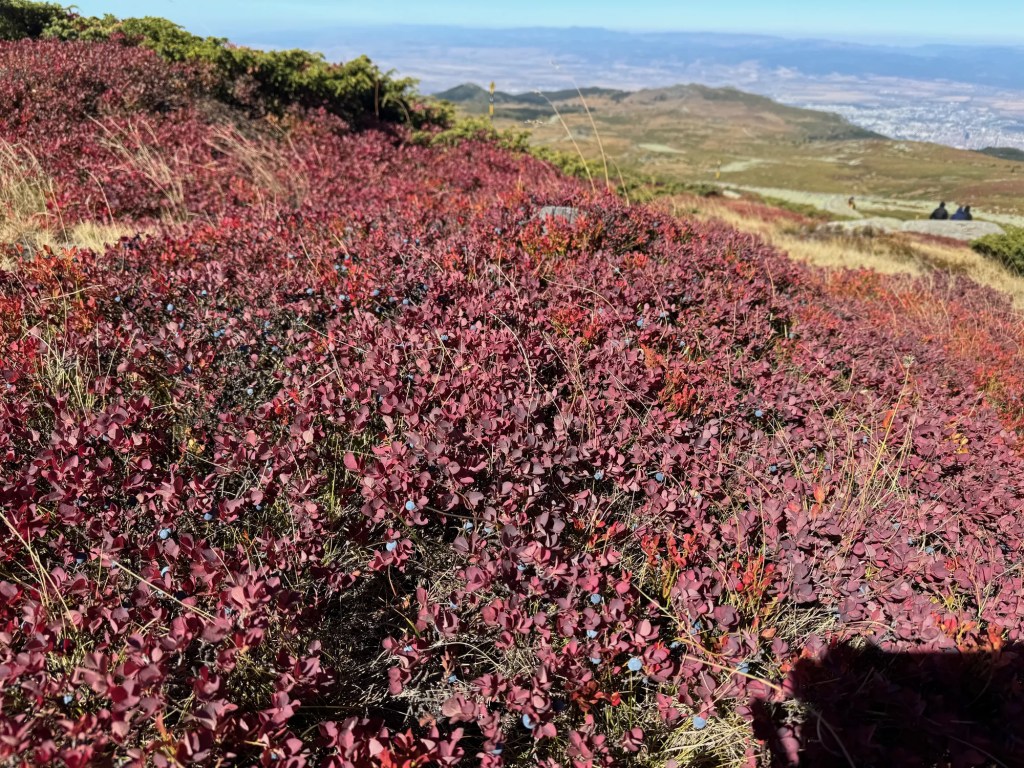
The top was cold, some of the puddles were frozen. We have some time until the first winter conditions, though, as despite the cold, I don’t expect snow before December. I hope to have the chance to go to the top again this year.


