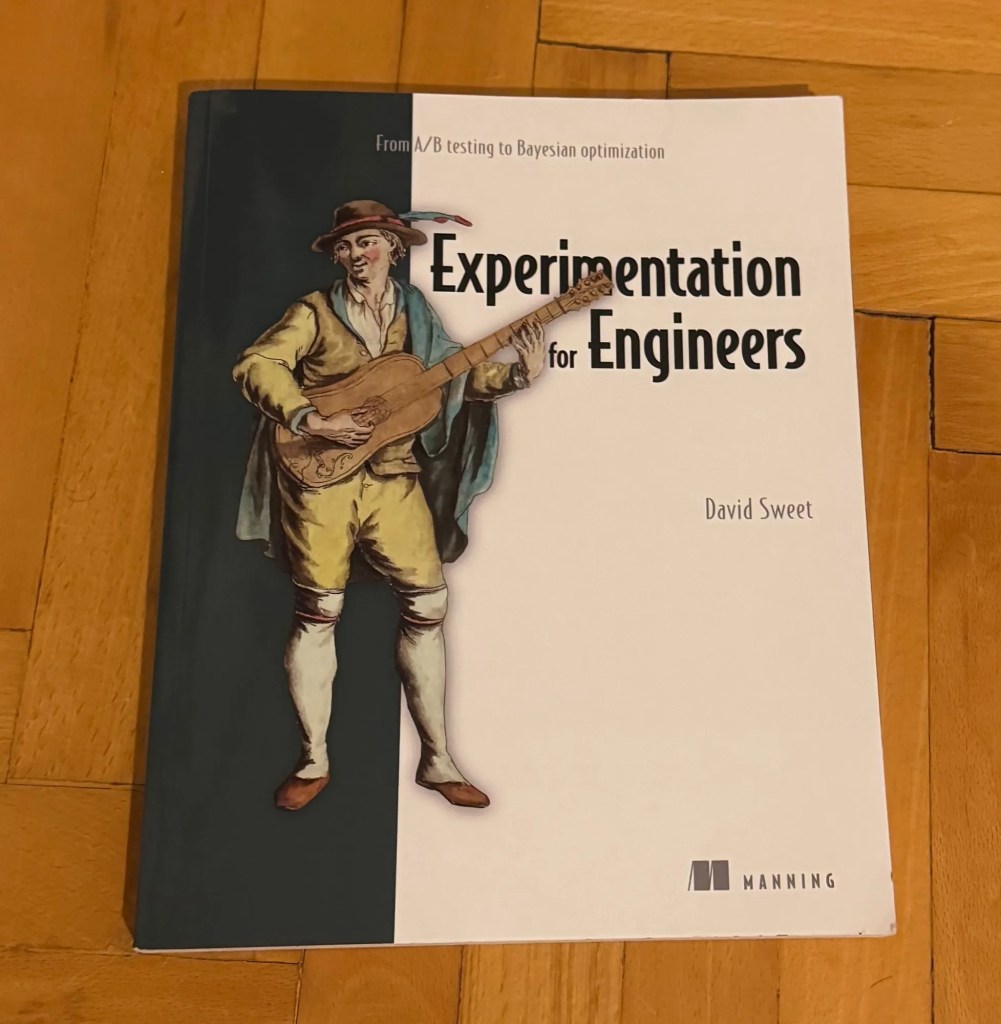
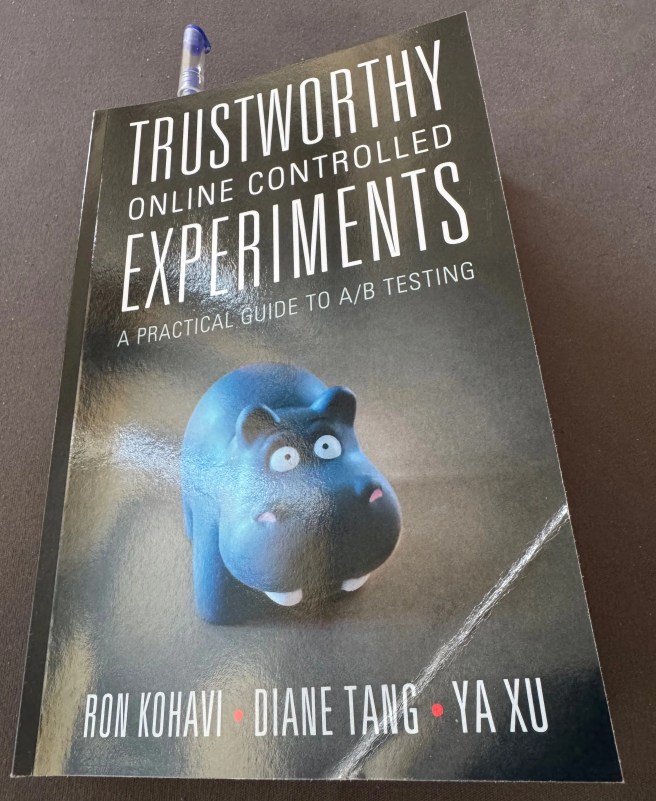
I managed to complete this book, which is quite an achievement. Unlike the last two I read on the subject, this was not an easy read. Lots of abbreviations, terminology, python functions, charts that represent hypothetical scenarios I couldn’t relate to, and more questions than answers. Why does that work? How does it work?
I’m not sure if this is necessarily a bad book. Probably isn’t. The author clearly has experience in his line of work, which is very different than mine. So what this book showed me was that other methods exist and online controlled experiments is a broader topic than I assumed. Will I try using any of the python functions or the methods inside? Not likely. However, knowing what can be done is still valuable and may come in handy one day.
I think I wasn’t the right audience for it, which lead to some disappointment. However, I want to learn more about multi-armed bandits and contextual bandits and may check what’s available on Amazon in the area.
This book is a rare jewel that I would recommend to anyone, running A/B tests. Pretty happy with the purchase and my time spent with it.
After I figured out that something with my understanding of how experiments should run was off, my instinct was that it’s math and stats skills that were lacking. So I looked into improvements in the area of probability and statistics first and my last two self-improvement books where in that area. Trustworthy Online Controlled Experiments isn’t about math. It contains condensed experience from people, wrangling experiments at Google, Microsoft, and LinkedIn, and then has some advanced chapters, intended to make the book complete.
The area that stuck with me the most was how to pick metrics for evaluating experiments and what to do with them.
For example, one of my most beloved revenue metrics (average revenue per user) is considered a health metric by the authors and their reasoning very solid. They argue any primary metric should be around user journey, usability, and satisfaction, around the purpose for the specific service. Revenue is an indicator how well the overall system performs but better indicators exist that are also easier to move with an experiment.
Many other metrics I currently frequently check, the book categorizes under drill-downs of existing metrics. The book also highlights the importance of having classical log data, like server errors, in the experiment dashboard. The authors list 20-ish industry standard metric ideas but also state that their internal systems have 1000s of metrics. What could these be? This statement also makes me wonder, how do they even make any calls, if they have so much data? Sounds like a good problem to have.
Regarding the number of metrics, the next book on the subject I picked, called Experimentation for Engineers, has a lengthy chapter about optimizing for just one metric. Then another lengthy chapter about optimizing for two metrics. Is that just a matter of taste? Being spoiled by the ideas of Trustworthy Online Controlled Experiments, I didn’t like it.
Imagine a page with two buttons, and we make one of the buttons orange in the treatment variation. Two clear metrics here can be clicks on the modified button and clicks on the non-modified button, together with the general metrics, available for all experiments. If the orange button gets more clicks, the other one will get fewer clicks. Such is life and decisions should be informed based on both changes. It’s also possible that the total number of clicks goes down because people perceive the page as spammy due to the orange color, despite orange clicks going up.
Optimizing for one thing without knowing the others can work but only in scenarios where there is really just one thing. For example, algorithmic trading of a specific stock. Optimizing for one metric while staying oblivious about the others and can produce errors and eventually erode the trust in experimentation.
So, thanks for reading this brain dump. It’s not about a cat, it’s not a quite a book review either because it covers just one area the book touches, but what can I do. The things that fascinate me are sometimes unusual.
Experiments in the context of software involve showing different groups of people different UIs or features and measuring the impact. This is one way to make informed decisions based on data rather than opinions. If experiments aren’t used, decision-making is usually subjective and prone to errors.
Humans are not good at predicting the future. We may be able to guess where the bus will stop next, but try guessing the price of Bitcoin next year. Being able to properly evaluate the outcome of decisions has real value, while relying on opinions can lead to irreversible losses.
Experiments are one way to get that data, and they’re something I’ve practiced a lot over the last two decades. I can say I have some experience, good or bad. But how far did I get with my own understanding of what a mature experimentation system should be?
The book I’m reading introduces a very interesting metric for experimentation maturity, based on the number of experiments, run per year. Metrics like this can certainly be criticized as superficial, it’s comparable to lines of code written or numbers of PRs. But having a metric is better than not having one, so here’s the maturity model from Trustworthy Online Controlled Experiments, Chapter 4. Numbers apply for large online services, like Google.
Crawl phase: <10 experiments/year, few metrics, no internal system, manual post-experiment analysis
Walk phase: up to 50/year, establishing standard metrics and some setup and data validation procedures, some internal systems and scorecards are available
Run phase: up to 250/year, adoption at a level where most decisions are verified; the focus is on scaling, ease of use, increased number of standard metrics (100s to 1000s)
Fly phase: 1,000s/year, a memory system is developed, the process is built around experimentation, shipping is easy, proper learnings and knowledge are preserved, metric drill downs (mentioned later in the book), thousands of metrics
The book isn’t exactly clear about when you’re out of Run and into Fly, given that one is around 250 experiments and the other is 1,000+, but it at least gives you a way to estimate roughly where you are if you’re running experiments.
It also doesn’t talk much about metric classification. As experimentation matures, metrics should be grouped into categories, with drill-downs for important characteristics. Some of the examples of what should be available felt very strong, like things I wish I knew sooner.
This book is great. I’m about 20 pages away from the end, and I have enough notes to write a chapter rather than a blog post. The last chapters are full of formulas and take time, as some of the formulas are not something I’ve encountered before. I learned stats with pen and paper, making countless calculations of averages, standard deviations, p-values, and such by hand. When I encounter a new stats formula, my brain wants to see the tables behind it, the charts behind it, the history behind it, and it refuses to move on by just accepting it.
It’s been awhile since I completed a popular science book. This one was good. It was about the process of exploring new physics but you can replace the physics with software engineering and it remains relevant, or at least it remains relevant for me. I enjoyed it and I feel full of ideas.
My main takeaway from Sabine Hossenfelder’s work is that our perception of beauty is frequently holding progress back. All progress in Physics was achieved by sacrificing the old understanding of what’s beautiful in favor of something that’s temporarily perceived as ugly, illogical, but better explains the world. It seems to me that this statement could be extended outside of science to Software as well, where progress is also usually done in random leaps, when new (or even old and failed) ideas suddenly break through.
What’s beautiful? My take from the book is that beautiful is something that’s symmetric, simple, understandable, familiar, and makes sense to our simple brains. Intuitive.
Let’s say we have the following series:
1, 2, 4, 8, 16
What’s the next number? Trivial answer would be that the series represents the powers of two, so next one is 32. A 6th grader will quickly point out to 32 as the obvious answer. However, 31 is also a less obvious next, because it appears in Moser’s circle problem. If we look at the number of divisors of n!, the next number is going to be 30. These options appear less and less natural but they’re not far off our intuitive expected answer, and we would not hesitate to accept them with the right context.
What if the next number is -1,031*10-17? We have a strictly positive series with natural numbers (positive integers), and we suddenly get a negative, and very tiny fraction, and no obvious explanation why? This can’t be right, right?
1, 2, 4, 8, 16, -1,031/10^17, ...
If that’s what we get from our data, our internal alarm rings a bell, and we would be looking for an error. And if we look for an error or a reason to give up, Hossenfelder says, we are going to find it. There’s a bias that comes from our expectation of what’s natural, because we won’t use the same rigor in verifying the results if the next number was 31 or 32. Of course, this isn’t the only bias that prevents us from seeing what’s right in front of our eyes. She summarizes multiple others, and even provides an appendix with advice on avoiding that in our line of work.
Data contradicting with our expectations is not a bad thing. There can be truth in the unexpected or disappointing data, if we know how to look at it. There can be lies in data particularly if we don’t know how to look at it. My next math-adjacent book, sitting right next to me, is called Everything is Predictable (such a clickbait-y title). I’m already deep into it and it’s quite complimentary to Sabine’s work.
Overall, Lost in Math is a great popular science journey. I also enjoy watching Sabine’s critical YouTube videos and recommend them too.
So far, I’ve found it great for making quick changes quickly. But when it comes to harder tasks, it gets difficult. Progress tends to come either by giving the AI very specific instructions, one tiny step at a time—or by iterating endlessly, like a sculptor chipping away at a boulder and ending up with a smaller boulder.
Still, it feels more productive than traditional coding in many cases, and it feels like the future. But there are real trade-offs, especially when the code is complex or the required change is significant.
I don’t have answers yet. For now, here’s a photo of a waterfall.