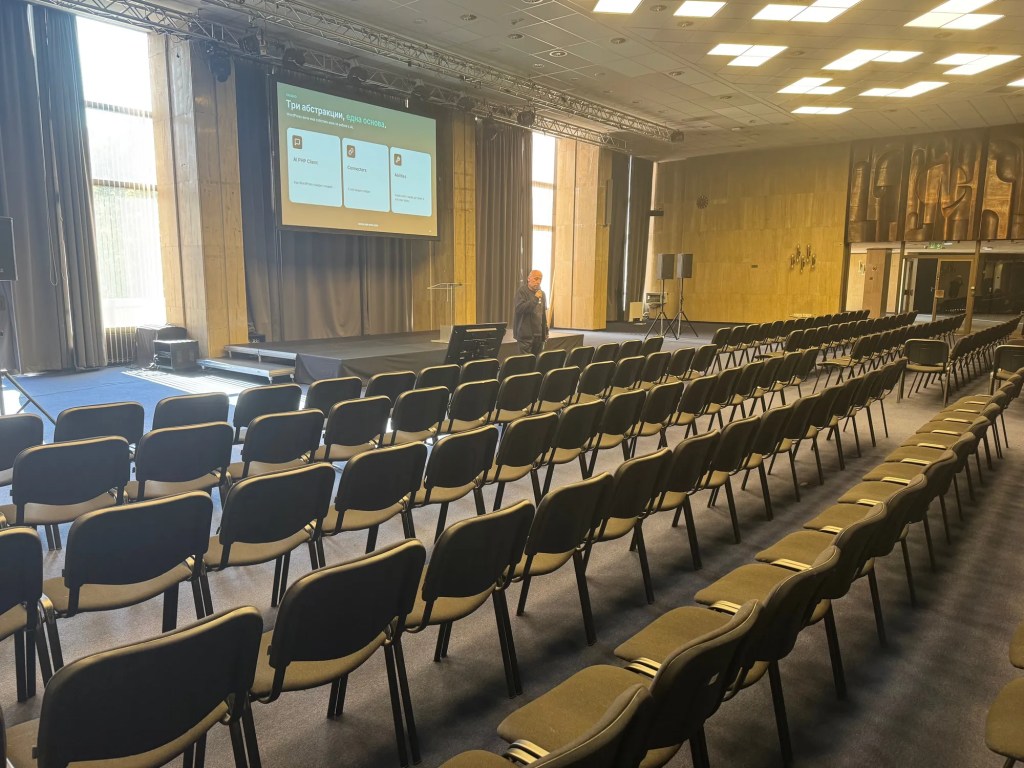
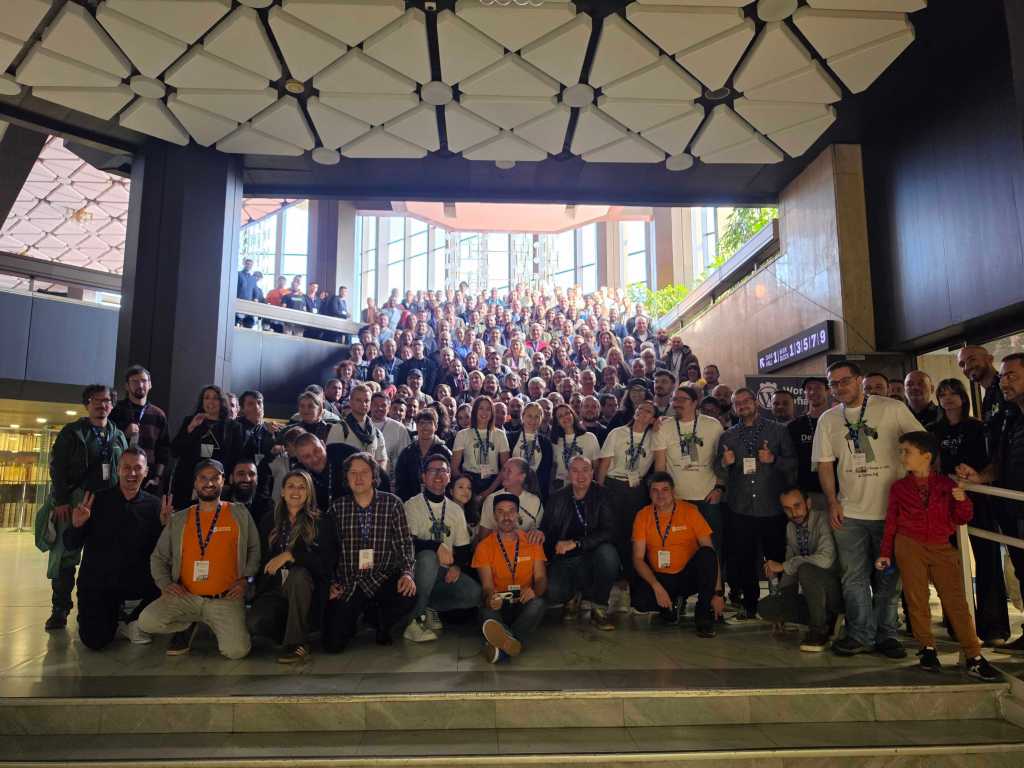
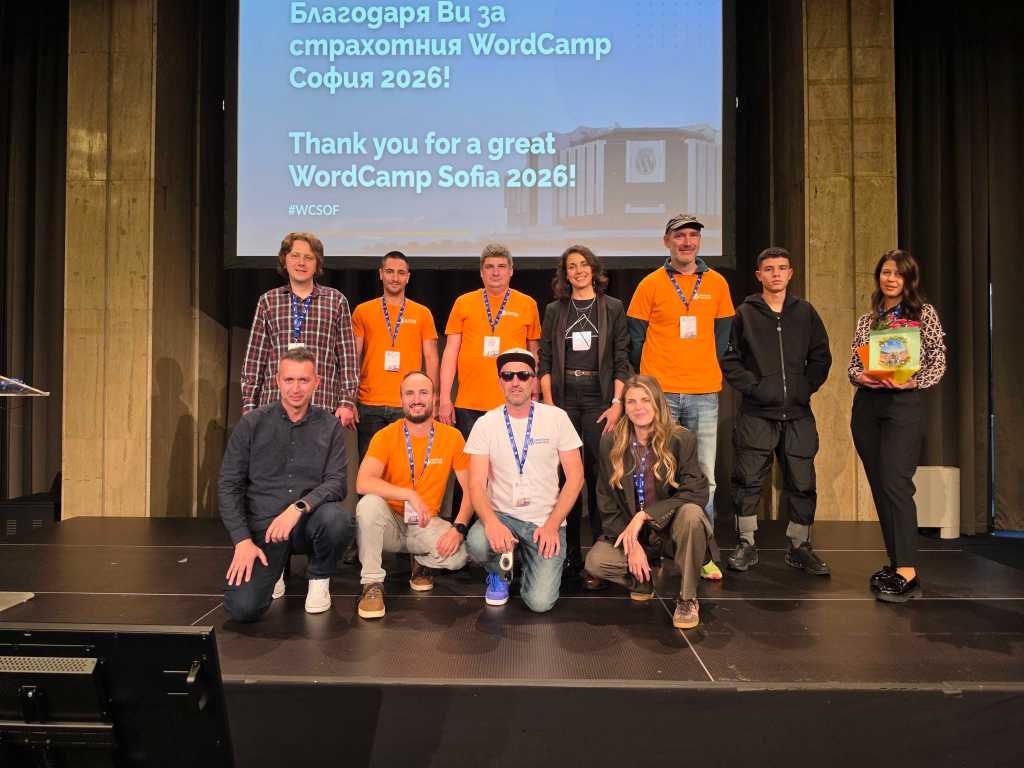
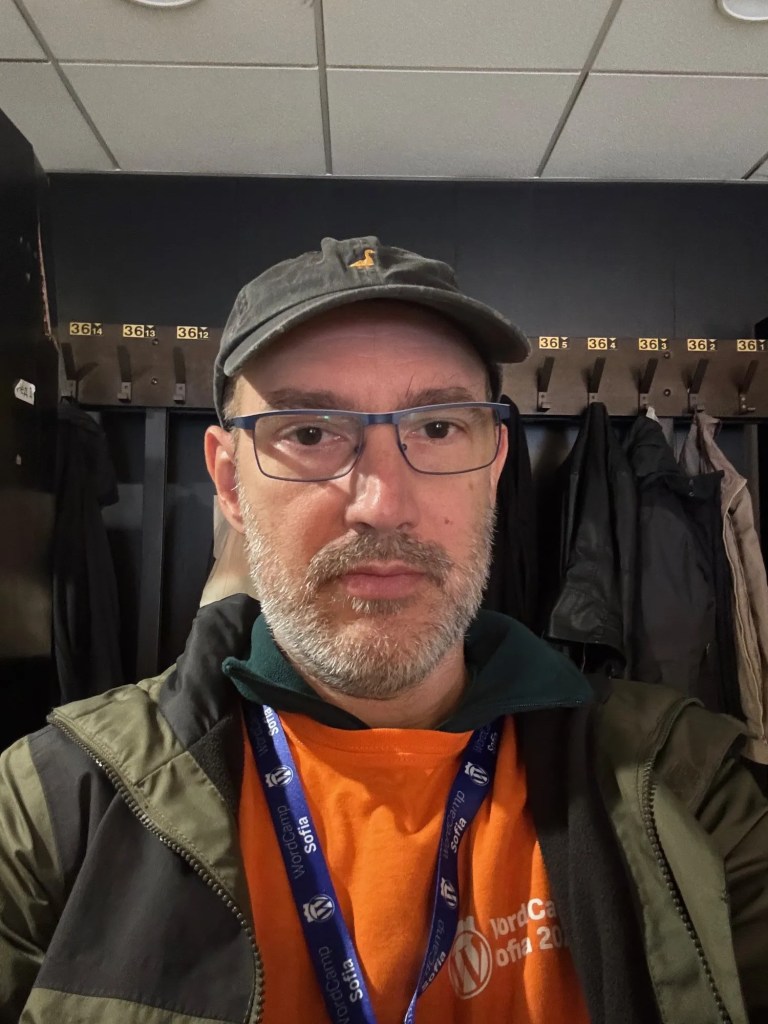
WordCamp Sofia attendees & Organizers + Volunteers. The last photo is missing some of the volunteers who had to leave earlier.
With the Contributor Day also over, I think I can go back to posting cat photos and book reviews.
Cats, good books, AI, and religious walking in the city of Sofia
WordCamp Sofia attendees & Organizers + Volunteers. The last photo is missing some of the volunteers who had to leave earlier.
With the Contributor Day also over, I think I can go back to posting cat photos and book reviews.
That was it, most of the WordCamp is over. Tomorrow is the Contributor Day, when we traditionally gather together to do small contributor tasks. For me, that’s usually translations and validation.
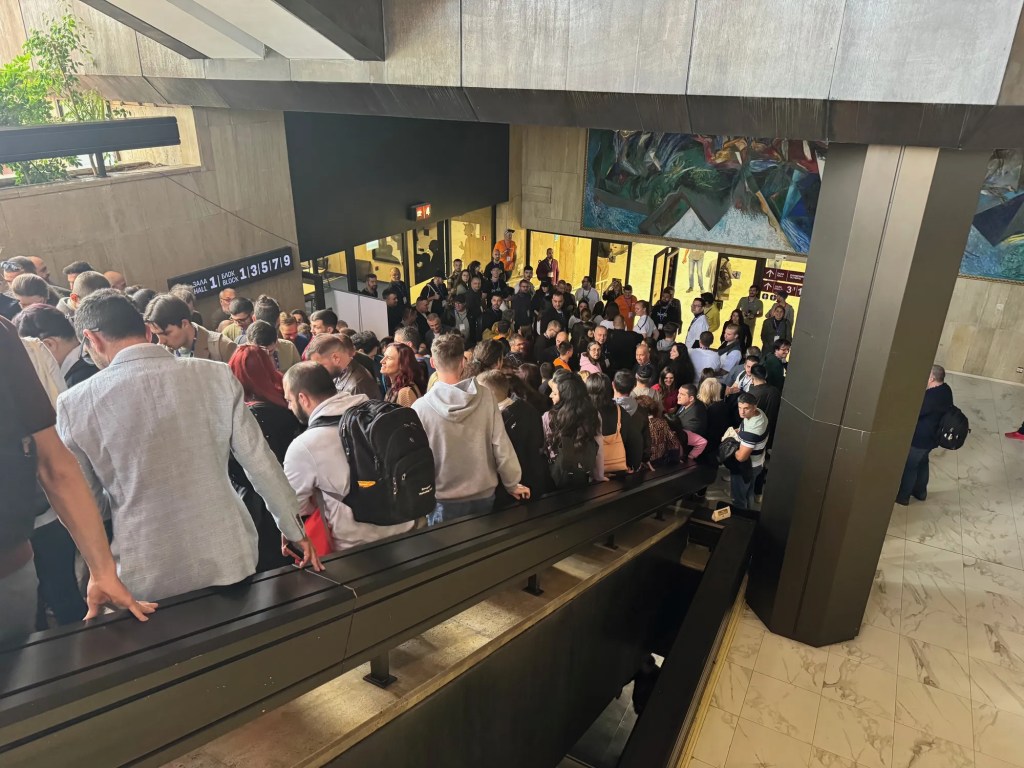
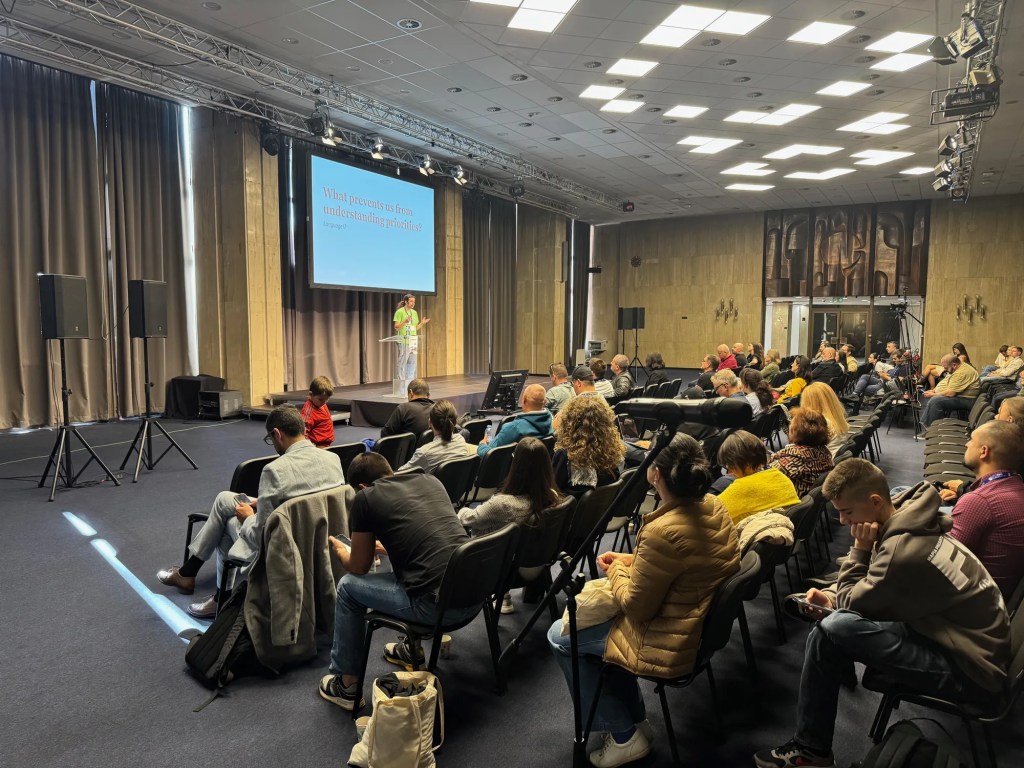
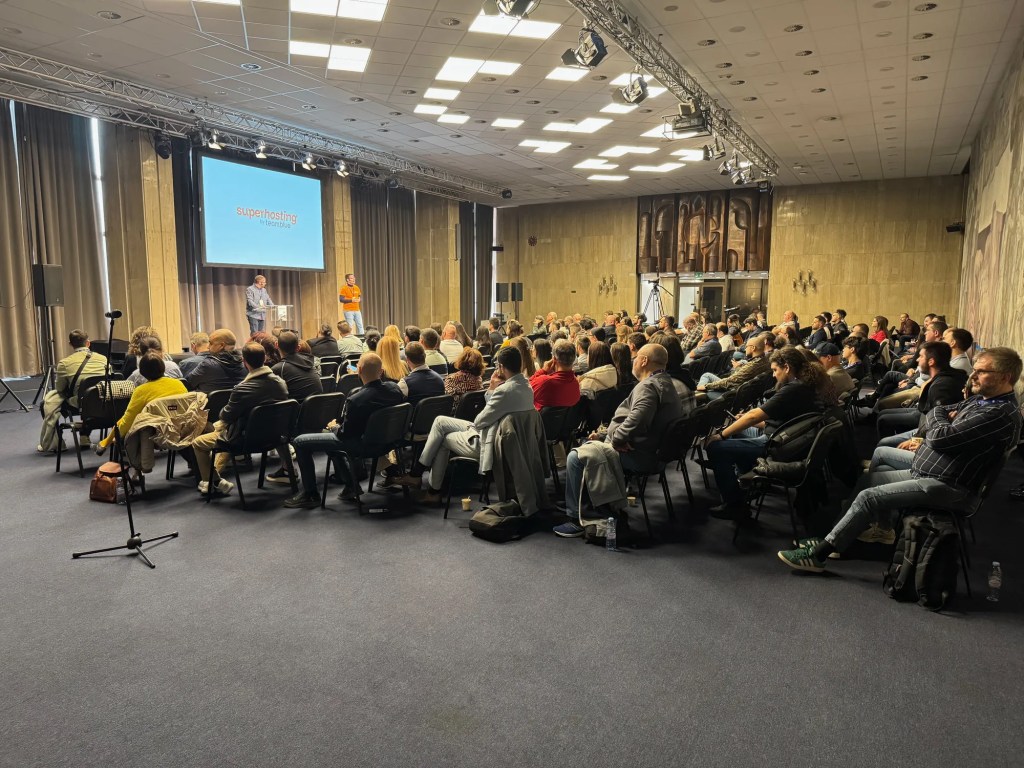
2 halls, 19 speakers, 300+ attendees who showed up (the exact number will remain unknown). Over 100 people stayed for the closing remarks. We had the latest check-in in the recorded history (under my watch), after 17:00. Food was good, coffee was good, snacks were plentiful. It was a lot more a web-in-the-AI-era conference than a WordPress one but this is what the speakers wanted to talk about. The team was strong and positive, true pleasure to work with.
A large amount of volunteer work was done by 3 teenagers from different schools, whose parents were organizers or speakers. I’m very thankful to have had the chance to work with them. Bright young people.

On top of being the lead of the Volunteers team, I was also responsible for a large pile of tote bags, that were Jetpack’s swag. I managed to get all of the tote bags picked up. I couldn’t do the same with our Jetpack stickers. Tote bags good, stickers – boo.
The MCP feature gives you the ability to talk to your site using AI tools, like my current favorite, Claude Code. You can ask it to fact check and fix things, for example. It will remain free until December.
I normally only let myself use AI for work-related texts, not for personal. I asked it to fix the alt text of an image for the purpose of this post. It edited it.
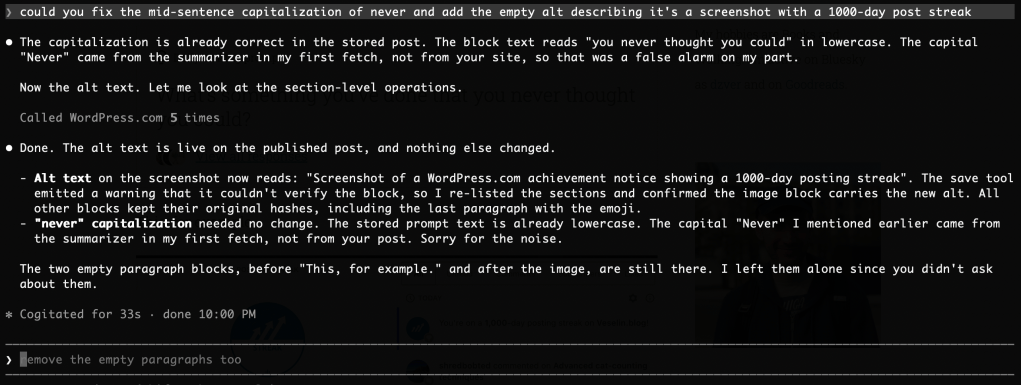
This, for example.
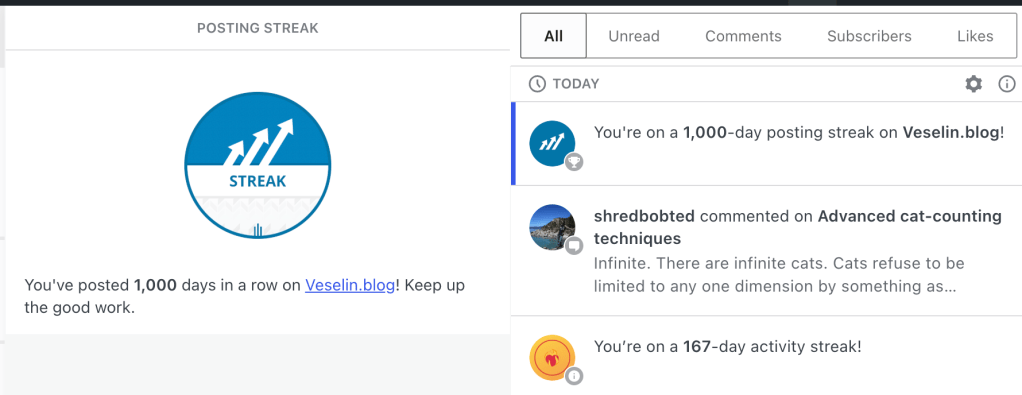
And of course, I’m on a 167-day activity streak while also on a 1000-day posting streak 😀 That’s also not easy to do.